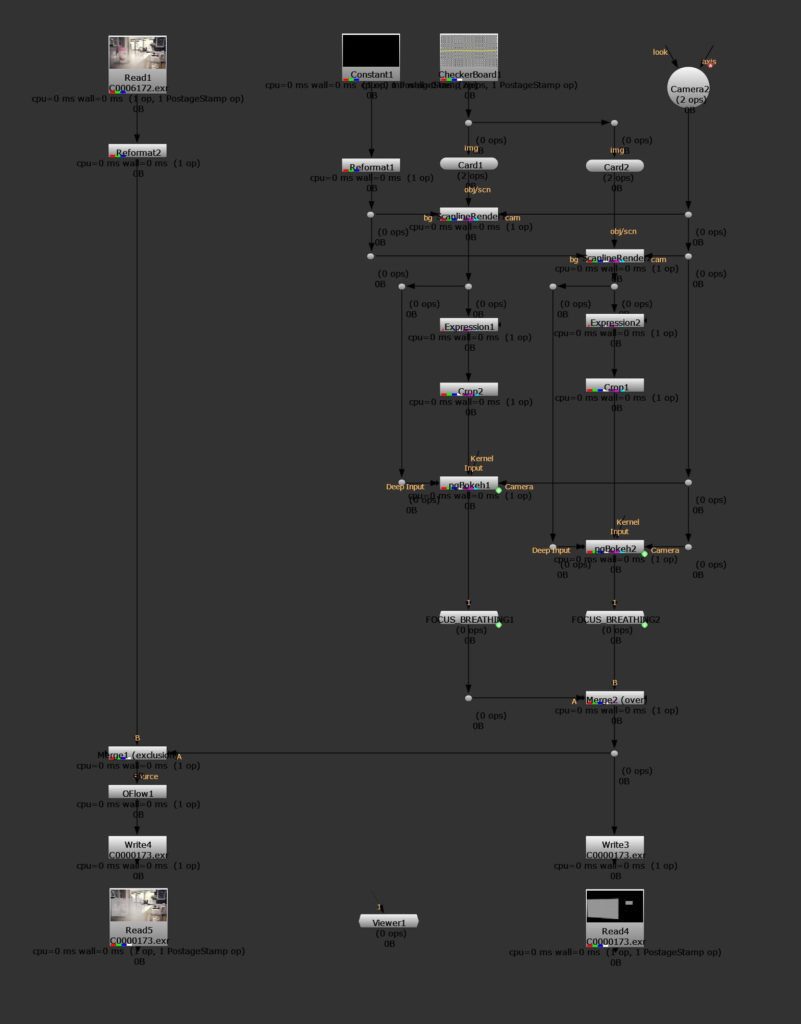
Comp scripts can get bloated up quite easily, especially the closer we get to our show deadline. Turn arounds have to be quick and this includes rendering your script as fast as possible.
Monitoring your node performance can help you stay in control.
In Nuke, there are 4 main stages of processing a node:
- Nuke stores the knob values, that the user has entered and/or selected (STORE)
- The node will inform the software about the output it will produce – for example channels and size of the result (VALIDATE)
- The node will request required data from its inputs (REQUEST)
- The node generates its output and most of the processing time is spent (ENGINE)
Nuke comes with a built-in tool called “Performance Timers”.
One way to enable this feature is by typing the following command into the script editor:
nuke.startPerformanceTimers()
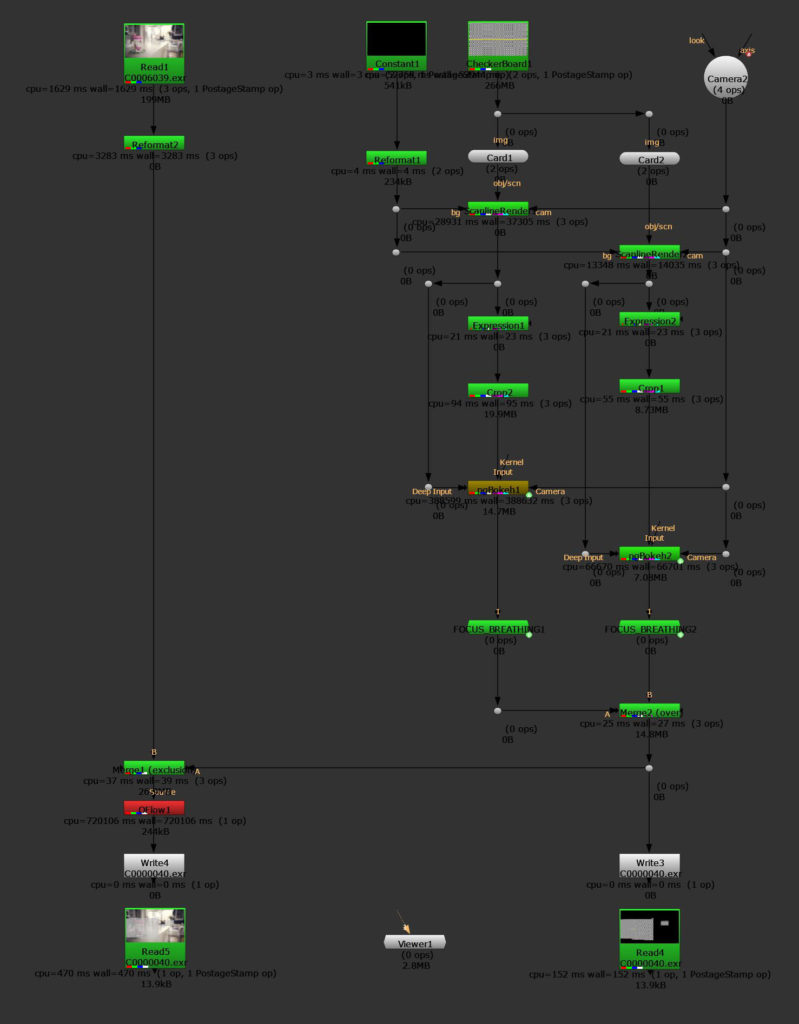
Once you hit the play button, Nuke will start color coding nodes – going from green for fast nodes over to orange and red for very slow ones.
Additionally it prints out speed data for every single node.
- CPU – time in microseconds that your CPU spent executing the processing code (aggregated over all CPU threads)
- WALL – actual time in microseconds you have to wait for the processing to complete
- OPS – number of operators called in the node
- MEMORY – total amount of system memory used by the node

But – the wall indicator is enough for us to judge what’s going on in the script.
In order to reset our performance timers we use:
nuke.resetPerformanceTimers()If we want to stop the profiling we use:
nuke.stopPerformanceTimers()Performance Profiling can also come in handy if you just want to quickly compare different approaches and techniques.
Accessing performance timers via panel
We can make accessing the performance timers more convenient.
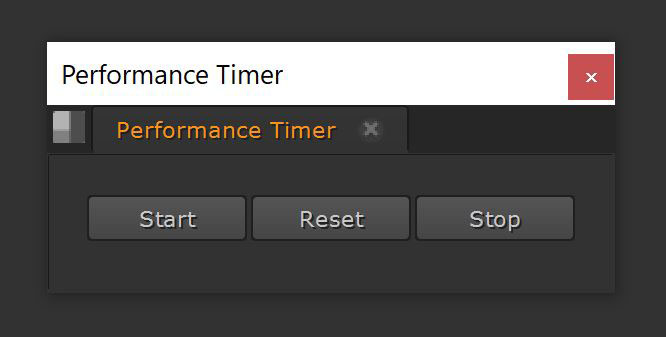
Let’s create a python script (perf_time.py) and assign our 3 functions from earlier to some buttons of a simple python panel:
import nuke
import nukescripts

class PerfTime(nukescripts.PythonPanel):
    def __init__(self):
        nukescripts.PythonPanel.__init__(self, 'Performance Timer', 'com.splitthediff.perfTime')
        self.knob_start = nuke.PyScript_Knob('start', label='Start', command="nuke.startPerformanceTimers()")
        self.knob_reset = nuke.PyScript_Knob('reset', label='Reset', command="nuke.resetPerformanceTimers()")
        self.knob_stop = nuke.PyScript_Knob('stop', label='Stop', command="nuke.stopPerformanceTimers()")
        self.addKnob(self.knob_start)
        self.addKnob(self.knob_reset)
        self.addKnob(self.knob_stop)

def show_panel():
    p = PerfTime()
    p.show()
If we add some lines to our menu.py we will be able to access the panel from the Nuke menu up on top of the Nuke window.
import nuke
import nukescripts
import perf_time


nuke_menu = nuke.menu('Nuke')
split_nuke_menu = nuke_menu.addMenu('Split The Diff')
split_nuke_menu.addCommand('Performance Timers', 'perf_time.show_panel()')

Another option of accessing this tool is by adding it to Nuke’s pane menu.
That way it will be available from wherever you can open pane panels and you can even save the configuration as a layout.
Let’s add the necessary lines to our perf_time.py file…
def add_perf_time_panel():
    global perf_time_panel
    perf_time_panel = PerfTime()
    return perf_time_panel.addToPane()
…as well as to our menu.py file:
pane_menu = nuke.menu('Pane')
pane_menu.addCommand('Performance Timers', perf_time.add_perf_time_panel)
nukescripts.registerPanel('com.splitthediff.perfTime', perf_time.add_perf_time_panel)
If you would like to access a nodes’ performance stats via python, you can do this with the performanceInfo() method.
Of course you can also run all of the nodes of your script through this command.
#Python3

for node in nuke.allNodes():
   print(node.name())
   print(node.performanceInfo())


#Python2

for node in nuke.allNodes():
   print node.name()
   print node.performanceInfo()
Remember the stages of node processing I mentioned earlier?
- nuke.PROFILE_STORE
- nuke.PROFILE_VALIDATE
- nuke.PROFILE_REQUEST
- nuke.PROFILE_ENGINE
By passing one of those 4 arguments, you can obtain the specific stats of that stage.
For example:
node.performanceInfo(nuke.PROFILE_REQUEST)Start NUKE with Performance Profiling activated
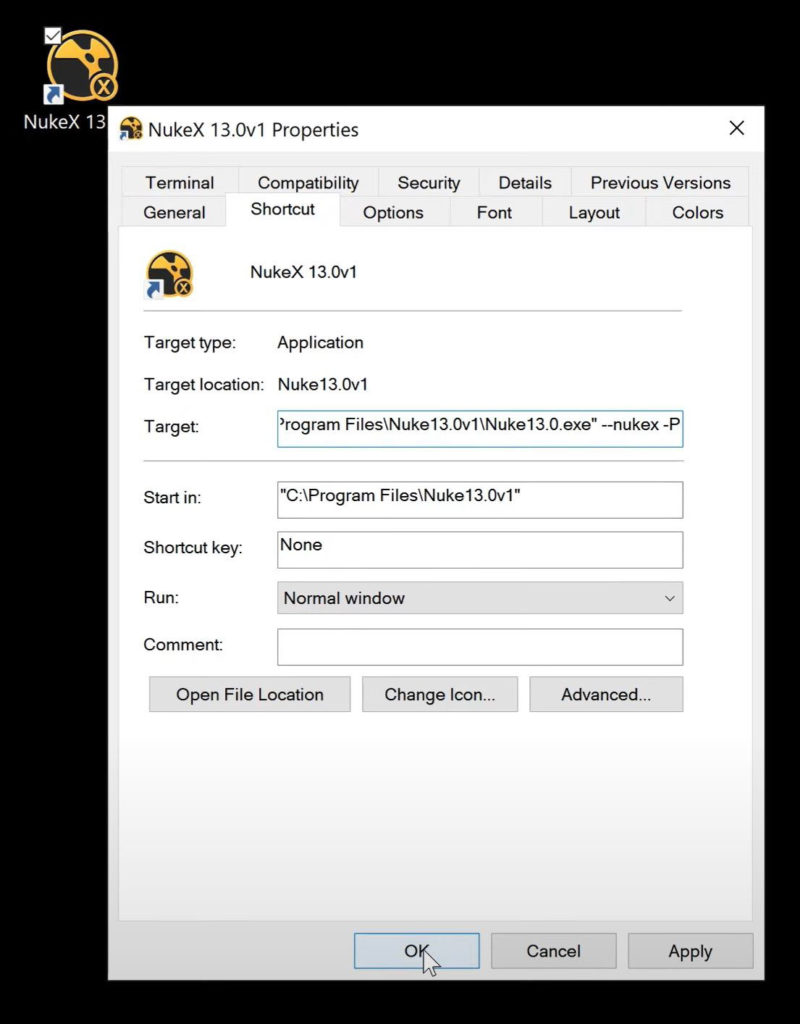
If you want to start Nuke with Performance Profiling activated just add the flag -P either in the command line when you start Nuke from there or you add it to your desktop icon shortcut in the properties.


As an additional feature you can let Nuke write out an xml file during render time that prints all the data mentioned earlier over the whole render range. In order to activate this feature you will have to use the flag -Pf followed by the location and name you want to choose for the xml file.

Alternatively you can also use this flag for rendering from a command line.
Opening the xml file in a text or scripting editor shows you all the content but it’s a bit hard to look at and difficult to filter out specific data.
I wrote a little python script that lets you have a look at the values in a lightly more convenient way.
You’ll just have to open the panel in Nuke, pick the xml file location, type in the node name you would like to see the data for and then choose the stat types. This will print out the responding values for all the render frames – so you can easily see the progress over time and if there are certain frames that cause performance or bottleneck problems.
You can find this tool and all the other python scripts mentioned here: Performance Timers Python
